
BNB vs Ethereum Fees remain a defining topic of discussion in 2026, serving as a primary case study of how different blockchain architectures trade off decentralization for transactional cost-efficiency. While both networks support massive decentralized application (dApp) ecosystems, the difference in their fee structures impacts where developers deploy their smart contracts and where retail users choose to trade.
As the decentralized landscape expands, retail participants demand efficiency. High transaction costs can lock out smaller participants from decentralized applications (dApps). Analyzing the underlying architecture of both chains reveals how technical design decisions directly impact your wallet.
The chosen consensus model plays a vital role in determining BNB vs Ethereum Fees. Ethereum uses a decentralized Proof of Stake (PoS) system with hundreds of thousands of validators. This high level of decentralization increases security but also raises network gas fees when traffic spikes. The resource-intensive nature of syncing a massive global network limits native Layer 1 throughput.
In contrast, BNB Chain relies on Proof of Staked Authority (PoSA). This streamlined model uses a smaller group of active validators to confirm blocks. Consequently, BNB vs Ethereum Fees favor BNB Chain because its network requires less global computer power to process transfers. This technical design prioritizes execution speed and cost-efficiency over extreme decentralization.
Network capacity, or transactions per second (TPS), directly affects BNB vs Ethereum Fees. BNB Chain handles over 5,200 TPS in 2026, with confirmation times under one second. Because block capacity is very large, users do not need to overbid on gas. This continuous optimization ensures that network congestion rarely impacts the cost of standard transfers.
Conversely, Ethereum Layer 1 handles around 15 to 30 TPS, causing high user bidding during market peaks. While Layer 2 (L2) rollups reduce these expenses, moving assets between layers adds complexity. Comparing BNB vs Ethereum Fees reveals that BNB Chain provides high throughput natively on Layer 1. Users enjoy a smooth experience without navigating multi-chain bridges.
To fully appreciate how BNB vs Ethereum Fees impact daily activities, it is useful to look at common on-chain tasks. Transferring tokens, interacting with decentralized exchanges, and minting digital assets present very different financial scenarios on each chain. These real-world cost variations dictate user behavior and project deployment choices.
On-chain statistics in 2026 show that a standard token swap on a decentralized exchange is often where the fee gap becomes most noticeable. Retail traders looking to swap smaller amounts can find their entire capital eaten up by transaction costs on a congested network. This makes low-fee environments essential for sustaining retail participation in decentralized finance.
To understand the practical impact of these networks, we can look at average transaction costs across both ecosystems in 2026.
| Transaction Type | BNB Chain Native Fee | Ethereum L1 Native Fee | Ethereum L2 Fee (e.g., Base) |
| Standard Token Transfer | $0.01 – $0.03 | $0.15 – $0.50 | $0.001 – $0.01 |
| DEX Token Swap | $0.02 – $0.05 | $0.50 – $2.00 | $0.01 – $0.05 |
| Smart Contract Mint | $0.05 – $0.10 | $1.00 – $5.00 | $0.02 – $0.08 |
| Target Audience | Retail, GameFi, Micropayments | Institutions, Whales, Large Settlements | Retail, High-frequency traders |
Source: Average network data compiled from historical fee trackers in 2026.
As shown in the table, the native Layer 1 cost difference remains a key factor. While Ethereum L2s offer highly competitive rates, they require users to manage assets across multiple networks. BNB Chain provides a unified, low-cost Layer 1 environment that eliminates the user friction associated with asset bridging.
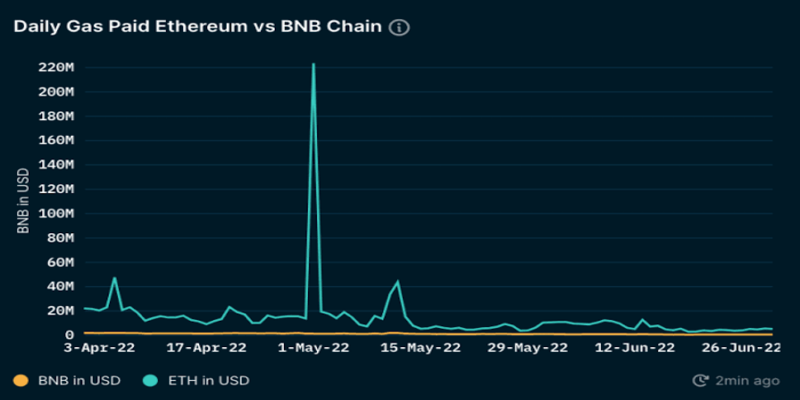
The large fee gap divides the user bases of these two popular chains. Educational platforms like BNB Guides help retail traders navigate this landscape, showing them how to save money on daily transactions. For smaller wallets, paying high gas on Ethereum L1 is simply too expensive. This education is key to helping users maximize their capital efficiency.
When reviewing BNB vs Ethereum Fees, it is clear that BNB Chain remains the best high-throughput, low-cost network for consumer apps. This accessibility allows retail users to interact with smart contracts without paying high network premiums. The ecosystem continues to attract developers focusing on gaming, micro-rewards, and community-driven projects.
When considering BNB vs Ethereum Fees, it is clear that BNB Chain remains the ideal high-throughput, low-cost powerhouse for consumer applications, high-frequency DeFi, and retail trading. This makes on-chain interaction highly accessible to users who want to avoid paying high network premiums.
Meanwhile, Ethereum serves as the premium settlement layer, offering unmatched security on its L1 while relying on its growing L2 ecosystem to capture cost-sensitive users. Ultimately, the comparison of BNB vs Ethereum Fees reveals that each blockchain has built a system tailored to a specific audience, allowing you to choose the exact environment that aligns with your capital size and security needs.


 Bitcoin (BTC) $ 78,577.00 0.6%
 Ethereum (ETH) $ 2,471.74 1.38%
 Tether (USDT) $ 0.999793 0.01%
 BNB (BNB) $ 690.33 0.65%
 XRP (XRP) $ 1.38 0.66%
 USDC (USDC) $ 0.999884 0%
 Solana (SOL) $ 103.09 0.25%
 TRON (TRX) $ 0.331720 1.47%
 Figure Heloc (FIGR_HELOC) $ 1.00 0%
 Hyperliquid (HYPE) $ 83.44 2.99%